
Made Visible #1: A Microkernel's Storage, Drawn
1739 words • 9 min read • Abstract
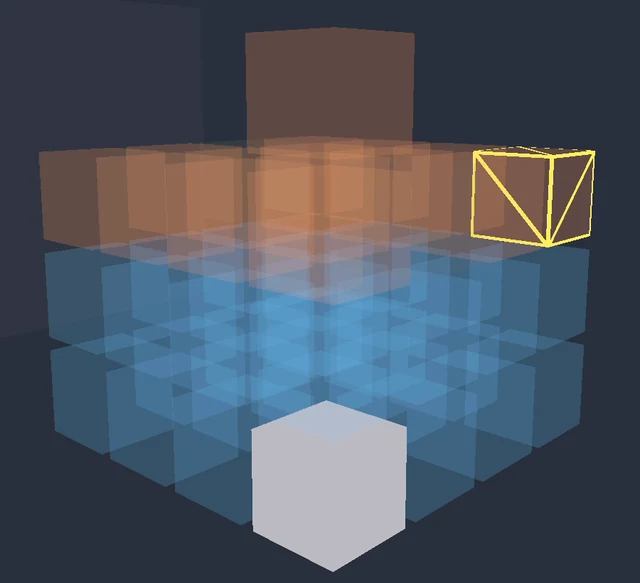
So: draw it. Blocks, stacked, colored by what they are, and turnable.
SWTOS is a microkernel for the COR24 — a 24-bit soft CPU on an FPGA, one megabyte of SRAM, no MMU, no hardware multiply. What is drawn here is its storage: the four-megabyte flash chip where programs live before they run, divided into eight-byte blocks and classified into a storage header, catalog records, program images, padding, and the free space that dwarfs all of them.
| Resource | Link |
|---|---|
| SWTOS | sw-embed/sw-tos · live terminal demo |
| native3d | sw-ml-study/demo-extensions |
| sw-MLPL | sw-ml-study/sw-mlpl · playground |
| COR24 | makerlisp.com · soft CPU · dev board |
| Prior art | FlashViz |
| Comments | Discord |
SWTOS
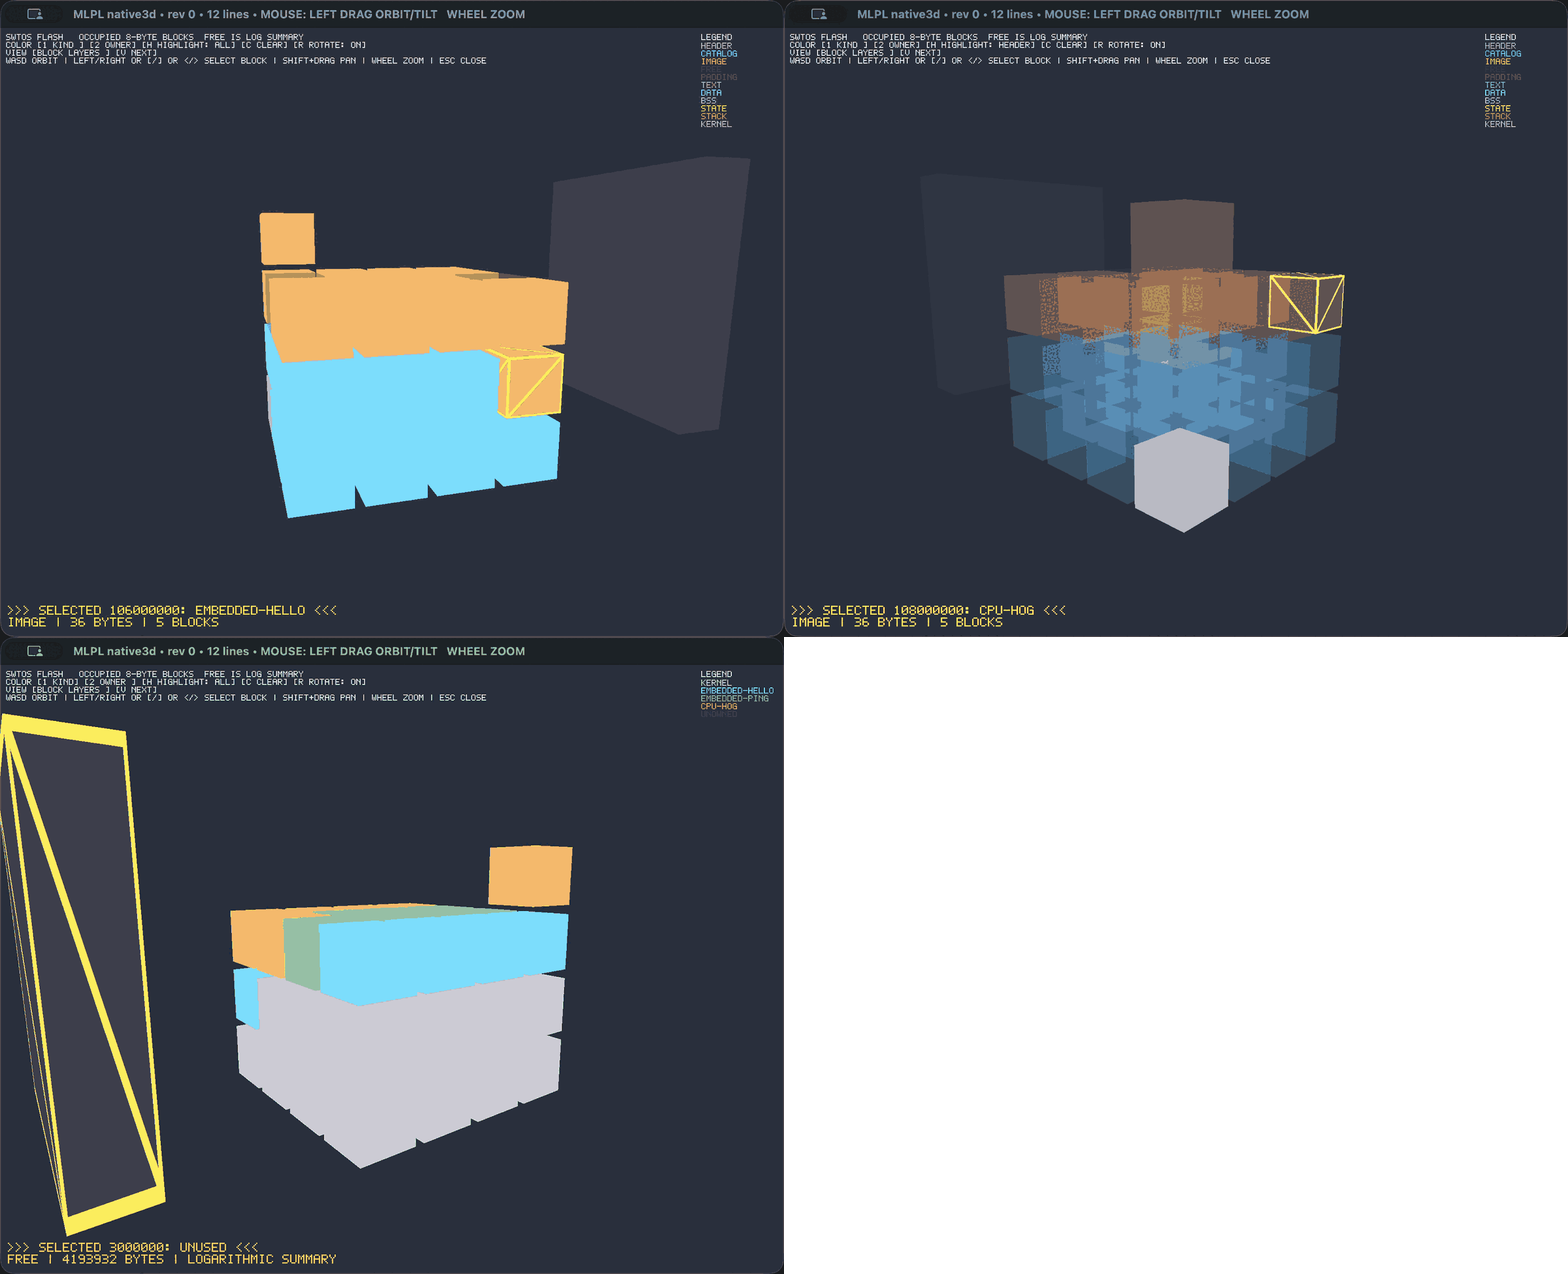
SWTOS is a microkernel for the COR24, a 24-bit soft CPU on an FPGA with a megabyte of SRAM. Its storage format is unusually good at being drawn: eight-byte blocks, an eight-byte header, fixed twenty-four-byte catalog records, block-aligned program extents, and whatever padding falls between them.
The interesting part is that it has two kinds of space, and the relationship between them is the thing that is hard to say in words. A program sits in flash as a stored image. Running it means a provider reads the extent, the image is validated, and text, data, BSS, process state and a stack are allocated out of a reclaimable generation in RAM. When the last child exits, the whole generation goes back at once.
The picture above is the first half of that: the storage space, drawn from the layout SWTOS publishes and pinned by hash to the build it came from, so it cannot drift into being a drawing of how things used to work.
Drawing it turns up a problem worth describing, because every memory visualizer has it. The W25Q32 holds four megabytes. At the eight-byte block SWTOS actually uses, that is 524,288 cells, and a real image occupies about forty-nine of them. Draw every cell and you get a solid wall with the interesting part invisible somewhere inside it; draw only what is occupied and you lose all sense of how empty the device is.
So the occupied and padding blocks are drawn as themselves, arranged in small layers, and the free space becomes a single summary block sized logarithmically. You can see that the catalog is tiny, the program is tinier, and the remaining space dwarfs both — which is the honest shape of the thing, and is not what either naive approach would have shown you.
The contract in the middle
Neither operating system knows this picture exists. Each emits a description of its own layout and stops:
{
  "spaces":        ["flash", "ebr", "sysram"],
  "space_block":   [8, 8, 8],

  "region_space":  ["flash", "flash", "flash", "ebr", "ebr"],
  "region_kind":   ["header", "catalog", "image", "text", "stack"],
  "region_owner":  ["kernel", "kernel", "hello", "hello", "hello"],
  "region_start":  [0, 8, 128, 0, 4096],
  "region_length": [8, 120, 44, 512, 1024]
}
Columns, not rows. Every region_* array has one entry per region and they are index-aligned, so region j is the j-th element of each.
That shape is not an aesthetic preference. It is the shape an array language can already eat: a homogeneous numeric array parses straight into an array value, a list of strings into a string list, and the whole document is usable the moment it is read. The row-oriented alternative — an array of objects, which is what most people reach for — would have required inventing a new kind of value to hold it. Choosing the format that fits the language cost nothing and saved a feature.
The visualizer also ignores columns it does not recognize, so a system is free to describe itself more completely than the picture currently uses — extra detail costs nothing and breaks nothing, and it is there when a later view wants it.
It also means the vocabulary is data. region_kind and region_owner are strings the producing system chose. Nothing downstream has a list of SWTOS region types compiled into it, which is precisely why MLOS could become a second producer by emitting its own words.
Three layers that do not know about each other
SWTOS / MesaOS /    knows storage semantics, nothing about pixels
MLOS
     │ emits layout
     ▼
sw-MLPL             knows visualization semantics, nothing about operating systems
     │ emits geometry
     ▼
native3d            knows graphics, nothing about either
     │
     ▼
3D viewer
The middle layer is where an array language earns its keep. Turning a layout into geometry is arithmetic on whole columns: take every region’s byte extent, convert to block indices, and place each block in a 16×16 layer.
x = mod(block, 16)
z = mod(floor(block / 16), 16)
y = floor(block / 256)
Three lines, and they run over every block in the system at once — there is no loop over cells anywhere in the visualizer. The classification is the same idea: map the region-kind column to a color per region, join the space column to its block size, assemble the centers and sizes as rank-2 arrays, and hand the whole thing over.
The bottom layer got what it needed to make that worth looking at: filled boxes rather than wireframes, since a hollow cube says nothing about how full anything is; stable per-box identifiers, so clicking a block can report which program owns it; and an orthographic mode, because “is this region bigger than that one” is a question perspective actively lies about.
Color says one thing at a time
The failure mode of every memory-map visualizer is encoding four meanings in one rainbow. So color carries exactly one, and you pick which:
| Mode | Color means |
|---|---|
| Kind | header, catalog, image, padding, free, text, data, BSS, state, stack, kernel |
| Owner | which program the region belongs to — kernel, shell, a loaded child |
One keypress switches between them and the legend changes with it. Selecting a block adds an outline rather than changing its color, so selection never competes with the thing you came to see, and a selected region reports itself in a callout: which program, which offset, how many blocks. You can also isolate one legend category at a time, which is how you answer “where is all the padding” without reading a single number.
The purpose vocabulary is closed and the lookup is strict: every kind a producer emits must have a row in the palette, and one that doesn’t is an error rather than a block quietly drawn the wrong color. That is the right trade for a picture whose entire job is to be trusted — a visualization that fails loudly is worth more than one that guesses.
Why this was worth building
Three reasons, in ascending order of how much they matter.
It documents two systems that are genuinely hard to document. The relationship between a stored image and a running process is a diagram in every OS textbook and a table of offsets in every real codebase, and the diagram is always idealized while the table is always true. This one is both: drawn from the same build artifacts the system itself uses, so it cannot quietly drift into being a drawing of how things used to work.
It makes the boundary reusable. The visualizer does not know what an operating system is. Any system that can describe its own memory in those columns gets the same picture, which is how the second and third arrived without changing the renderer — including one whose memory model has essentially nothing in common with the first.
It is dogfooding all the way down, which is the part I find most useful as a test. The systems being explained are mine, the language doing the explaining is mine, and the renderer drawing it is mine — so there is nobody to blame for a rough edge and nowhere to hide one. Every awkward step in this pipeline is a thing I now have to either justify or fix, and a few already turned into language changes. Using your own tools on your own problems is the cheapest way to find out which parts you were being polite about.
And it is a real test of what an array language is for. Consuming structured system data, classifying it, computing geometry over whole columns and driving a native extension is not the demo an array language usually gets asked to do. It is a better one than another matrix benchmark, because every step is something a person would actually want.
This is the first of three. The same viewer, unchanged, draws MesaOS — a conventional 64-bit kernel with paging and Ring 3 processes — and MLOS, whose scarce resource is not memory in the usual sense at all. Those follow.
Part 1 of the Made Visible series. View all parts | Next: Part 2 →
Comments or questions? SW Lab Discord or YouTube @SoftwareWrighter.