
Array Languages #7: X_eTaL-gpu, Array Programs on GPUs Old and New
4929 words • 25 min read • Abstract
| Resource | Link |
|---|---|
| The repo | softwarewrighter/X_eTaL-gpu |
| Live site | what runs today and the measured results · the documentation |
| The lowering | X_eTaL source to the GPU’s form |
| Prior post | Array Languages #6: X_eTaL-games |
| Comments | Discord |
The direction: a macro, not a translation
A GPU program should be just X_eTaL. That is now how it works: a function written in ordinary X_eTaL is marked for the GPU with a macro, and everything else happens underneath.
The Accel library
What a GPU can run is a subset of X_eTaL, and the repo keeps that subset as an ordinary, typed and tested library, Accel. Its 22 exports cover what the models need: elementwise arithmetic and masks, reductions, matrix products, attention scores and a weight gradient, the embedding lookup, the convolution’s windows, argmax and top-k, a dense layer and a softmax. Each is one array expression:
ˡr̲elu ← { x → x m̲ax 0 }
ˡs̲cores ← { q k → q '+ '× i̲nner o̲\ k }
ˡe̲mbed ← { t ids → ids s̲elect t }
ˡd̲ense ← { x wb → (x '+ '× i̲nner -1 d̲rop wb) + (o̲ffsets t̲ally x) 'r̲ight t̲able r̲avel -1 t̲ake wb }
The macro, gp:a_ccel<
A program imports the GPU facade and Accel, and marks a function for the GPU. Here is a network layer, from the repo’s accelerate demo:
"gp:" u̲se< "Gpu"
"ac:" u̲se< "Accel"
ᵘl̲ayer ← "float float" ᵍᵖa̲ccel< "{ x wb -> ac:r_elu x ac:d_ense wb }"
h ← x ᵘl̲ayer wb
On the right is the function, written as X_eTaL text on one line. On the left is how each argument is taken, float or int; an array of integers that the function looks rows up by, such as token ids, is passed as int. After that, u:l_ayer is called like any other function.
gp:a_ccel< is a macro, and like every X_eTaL macro it is a function from source text to source text. xetal expand shows what it writes:
ᵘl̲ayer ← ({ x wb → ᵍᵖo̲utput 1 ᵍᵖa̲fter ᵍᵖr̲un 0 ᵍᵖa̲fter 2 ᵍᵖb̲ind wb ᵍᵖa̲fter 1 ᵍᵖb̲ind x ᵍᵖa̲fter "{ x wb -> ac:r_elu x ac:d_ense wb }" ᵍᵖl̲ower "accelerate.xtl|float float" })
Read from the right, as X_eTaL evaluates: gp:l_ower hands the function’s text to the GPU extension, with the calling file, so the runner reads the same imports, and the arguments’ kinds. Then x is bound as the first input and wb as the second, gp:r_un 0 runs the program on the first OpenCL device, and gp:o_utput 1 reads the result back. gp:a_fter puts the calls in that order. Nothing in the expansion is GPU code; it is a few calls to the extension.
The extension does the rest. It lowers the function’s text through X_eTaL’s own compiler crates, for the shapes of the arrays actually bound, once per set of shapes, and keeps the session: a second call with the same shapes reuses the compiled program, and a call with new shapes is lowered again. The repo’s tests run a dense layer at two shapes, an embedding lookup with integer ids, and the softmax of attention scores this way on the M1 Max, each giving the evaluator’s own value, and they pin the macro’s expansion. The live site shows each of the demo’s definitions beside its expansion.
There are limits for now. The function takes one or two named arrays and returns one array, written on one line with no strings inside. Its libraries are the ones the calling file imports. Anything the lowering cannot take is refused with a reason.
The rest of this post is what was built and measured on the way, the pieces the macro stands on.
One program, three ways to run it
Every example is an X_eTaL program first, and the X_eTaL evaluator is the reference. Underneath is a small accelerator IR, typed arrays with elementwise maps and reductions, which runs two more ways: in a reference interpreter, and as OpenCL on a GPU. All three must give the same arrays, integers exactly and floats within 1e-5.
                X_eTaL program (.xtl)
                        |
          +-------------+-------------+
          v             v             v
      evaluator    IR interpreter   OpenCL on a GPU
          |             |             |
          +-------------+-------------+
                        v
                  the same arrays
Now the IR is produced from the X_eTaL source itself. The lowering takes a program’s Core, its libraries included, from X_eTaL’s own compiler crates and builds the program the device runs; anything outside the subset it handles is refused with a reason naming the construct. Before it existed, each example was also written out in the IR alongside its source, as scaffolding to build and prove each operation one at a time. Those served as the lowering’s test oracle: all twelve examples, lowered from source, give the evaluator’s answers on the M1 Max, and the written-out versions are gone.
From a line of X_eTaL to a kernel
Here is where a line of X_eTaL ends up, for one of the examples from the Accel library, the subset of X_eTaL a device can run. This is the path every program now takes:
ˡp̲ipeline ← { x w → ˡs̲um ˡr̲elu x + x × w }
The scheduler fuses the whole elementwise chain, a multiply, an add and a ReLU, into one kernel, one work-item per element, and lays out the sum as a tree in local memory:
// k0: 8 elements, one work-item each; computes %xw %s %pos
__kernel void k0(__global const long* b_x, __global const long* b_w, __global long* b_pos) {
    size_t i = get_global_id(0);
    if (i >= 8) return;
    long t_xw = (b_x[i] * b_w[i]);
    long t_s = (b_x[i] + t_xw);
    long t_pos = max(t_s, 0L);
    b_pos[i] = t_pos;
}
The tool shows each step: xetal-gpu kernel prints the OpenCL C, and xetal-gpu explain says which X_eTaL values became which kernels. How a device runs a program, its widths, work-group and tiles, is a schedule kept as one TOML file per device.
What runs today
Two GPUs have run it so far: the M1 Max in my main Mac, through Apple’s OpenCL 1.2, and an RTX 5060 Ti in an Arch Linux machine, through NVIDIA’s OpenCL. On both, every check agrees with the evaluator: the example programs, reductions from a thousand items to a million, axis reductions, tiled matrix products, a tiny two-layer network, and, new this week, transpose, the convolution’s windows, lookup, the embedding gather, and top-k, each row’s largest few. That set is now enough for the machine-learning models ahead. Lowering real programs also turned up a real bug: X_eTaL-ML’s top-k subtracted 1e300 to take an item out of a row, which is infinity in a GPU’s 32-bit floats and turned the row into NaN, while the CPU’s 64-bit floats hid it. The idiom now shifts by the row’s range, and the runtime refuses a number too large for 32 bits, naming the fix. On the 5060 Ti the checks also pass in 64-bit floats, which Apple’s OpenCL lacks. Through the bridge from post #4, an X_eTaL program calls the GPU itself.
When the GPU pays
A GPU is not automatically faster. Every offload pays fixed costs before a single kernel runs:
- Setting up and compiling. Creating a device context and compiling the kernels takes about 80 ms on the M1 Max and 150 to 300 ms on the 5060 Ti. With a session, new this week, that is paid once per program rather than once per run.
- Moving the arrays. Through the bridge as text, about 0.4 s for a million numbers. From binary files it is far less, but every new batch must still be uploaded to the device.
- The kernels themselves. Usually the smallest part: a fraction of a millisecond for everything measured here.
And there is a second question hiding in “faster”: faster than what? There are two CPU baselines, and they give very different answers.
Against X_eTaL’s own evaluator
X_eTaL’s evaluator is the reference, written for clarity, not speed. Against it, the line falls where you would expect:
| Work | Machine | X_eTaL evaluator | GPU | Against the evaluator |
|---|---|---|---|---|
| a thousand items | RTX 5060 Ti | 0.17 s | 1.29 s | too small: setup costs more than the work |
| a million items, elementwise, through the bridge | M1 Max | 0.19 s | 2.4 s | loses: moving the numbers costs more than the arithmetic |
| a million items, elementwise, through the bridge | RTX 5060 Ti | 0.25 s | 1.44 s | loses, the same way |
| the small ML benchmarks: a dense layer, a wide inner product, a softmax | M1 Max | 59 to 179 ms | about 90 ms | about even: setup is nearly all of the GPU’s time |
| a 512 by 512 product, through the bridge | M1 Max | 14.5 s | 0.46 s | 31 times faster |
| a 512 by 512 product, through the bridge | RTX 5060 Ti | 25.0 s | 0.98 s | 25 times faster |
| a 512 by 512 product, the whole checked program | M1 Max | 28.75 s | 0.13 s | about 220 times faster |
| a 512 by 512 product, the whole checked program | RTX 5060 Ti | 55 s | 0.30 s | about 180 times faster |
| the world model, all 1,936 states as one batch | M1 Max | 9.9 s | 0.11 s | about 90 times faster |
| the world model, all 1,936 states as one batch | RTX 5060 Ti | 15.1 s | 0.16 s | about 95 times faster |
The GPU times are whole runs, setup included. The world model’s kernels alone take 0.09 ms on the M1 Max and 0.24 ms on the 5060 Ti. The evaluator times differ because the machines do.
Against tuned CPU code
The stronger test is a CPU running optimized code. The GPU repo ran the trained world model, both layers with their biases, ReLU and sigmoid, on both GPUs, each against its own machine’s tuned CPU library: NumPy with Apple’s Accelerate on the M1 Max, and NumPy with OpenBLAS on the 5060 Ti’s 12-thread Xeon, taking the fastest thread count for each batch. Every run gives the same counts. The GPU keeps its kernels and weights resident in a session and uploads each new batch; the times are medians of repeated calls:
| World model, batch | M1 Max: Accelerate (ms) | M1 Max: GPU (ms) | GPU against CPU | 5060 Ti machine: OpenBLAS (ms) | RTX 5060 Ti (ms) | GPU against CPU |
|---|---|---|---|---|---|---|
| 1 state | 0.022 | 1.54 | 0.01 times | 0.073 | 0.21 | 0.35 times |
| 64 states | 0.10 | 1.79 | 0.06 times | 0.23 | 0.30 | 0.76 times |
| 256 states | 0.31 | 1.78 | 0.17 times | 0.47 | 0.66 | 0.72 times |
| 1,936 states, the whole world | 1.29 | 2.51 | 0.51 times | 1.94 | 2.97 | 0.65 times |
| 8,192 states | 4.68 | 5.50 | 0.85 times | 8.64 | 10.53 | 0.82 times |
The world model does not beat the tuned CPU library at any batch size measured, on either machine. The GPU’s kernels are fast: for the whole world of 1,936 states the 5060 Ti’s kernels take 0.24 ms. But each call also pays for its launches and for uploading the new batch, and that is about as much as the CPU’s whole computation. At 8,192 states the 5060 Ti’s upload alone takes 9.9 ms, against 8.6 ms for OpenBLAS to do everything. Apple’s OpenCL adds about 1.3 ms to every call, even with nothing to upload, which is why the M1 Max is so far behind on small batches. Running a batch already on the device is cheaper, but repeating identical inputs is not real work, and the repo refuses to count it. On both machines the gap narrows as the batch grows, to 0.85 of the CPU’s speed on the M1 Max and 0.82 on the 5060 Ti at 8,192 states.
The reason is the model’s size, and the measurements turn it into a rule. To beat a tuned CPU library, an example needs hundreds of operations for every byte it uploads, and tens of milliseconds of CPU work per call to outweigh the GPU’s fixed cost per call, about 0.2 ms on the 5060 Ti and 1.3 ms on the M1 Max. That means uploading only small things, token ids, queries or parameters, and keeping the weights, an index or a model’s state resident on the device. The world model does about 40 operations per byte uploaded, so it cannot win, and the plan does not chase it. The repo’s broader rule still holds, the batch is the array and the work is products, but against a good CPU library the products have to be big enough and the data has to stay put.
It also settles what counts as an example. Every one is a machine-learning use case, inference, retrieval, training, memory or experts, on a GPU without CUDA. Graphics, physics and pure-math demonstrations are left out, since any card runs graphics already.
That is the point of this work. It is not a race with large, new GPUs, or with tuned CPU libraries on small models. It is to show that an array language, extended with a native extension and the macros that write its facade, one line per GPU function, can get real value out of older and smaller GPUs on machine-learning tasks, and to find honestly where that value starts. Against X_eTaL itself it is already large. Against tuned CPU code it needs bigger work, which is where the plan goes next. The order is deliberate: first confidence in the use-cases and the measurements on a few current GPUs, then one or two older data-center cards.
The ML models on the GPUs
The machine-learning models from post #5 are the work this is for. X_eTaL-ML writes no GPU code. It hands over each model as a batch X_eTaL program, with its weights and expected outputs, and X_eTaL-gpu runs it on each device, soon from that program’s own source through the macro, as the examples already are, at the command line, since the live pages run X_eTaL as WebAssembly, which cannot reach OpenCL.
- The world model predicts a ball’s next frame from the last three: 432 pixels in, 64 ReLU units, 144 sigmoid pixels out. Over all 1,936 states it predicts 1,897 next frames exactly, and 348 of the 387 it never trained on, with the same counts on the evaluator, both GPUs and OpenBLAS.
- The benchmarks, a dense layer, a wide inner product and a softmax, agree on both GPUs within a relative 1e-5. They are small, and at best break even with the evaluator.
- A learned denoiser, new in X_eTaL-ML this week, draws 10 by 10 pictures, a disk, a hollow square or a cross, from noise in ten steps, 128 pictures at once, in 6.3 s in the evaluator. Its network is wider, 256 hidden units, and the ten steps are ten calls, so it will show what a session saves inside a loop. It is committed in X_eTaL-ML, and its network has been reshaped into a single function of arrays inside the subset the lowering handles, ready for the macro, with its pictures unchanged byte for byte.
- Two more batch programs are ready for the GPU, written as X_eTaL in X_eTaL-ML and checked against their Rust trainers. The Tiny CNN reads the first 1,000 MNIST test digits as one batch, every picture’s windows and one product for the whole batch, and gets 971 right, as its trainer does, in about 9 s in the evaluator. MicroGPT scores the first 1,000 names, matching its trainer’s loss to 1e-9 and predicting 2,098 of 7,000 next letters, in about 3.5 s. The CNN fits what the lowering is being built to handle; MicroGPT’s attention heads join arrays in a way the first version of the lowering will not cover yet.
Shrinking the fixed costs
Two of the fixes have landed:
- Binary arrays. Inputs can be bound from binary files instead of text. For the world model on the 5060 Ti, binding its inputs fell from 460 ms to 13 ms, and the whole process from about 1.06 s to 0.39 s. Results still come back as text.
- Sessions. A session compiles once, keeps the kernels and the device buffers, and uploads only the inputs that change: bind the weights once, then rebind each batch and run again with
gp:r_erun. The first call still pays 150 ms or so; the calls after it cost their upload and kernels.
What remains is the upload of each new batch, which the comparison above shows is now the main cost. Two things answer it: work that does more arithmetic per number uploaded, which is what the next examples are built for, and hiding the upload behind the work, which is the next fix.
-
Pipelining, planned. The aim shifts from how fast one call returns to how many items per second a stream of calls sustains. The batch is cut into chunks, so that while one chunk computes, the next is uploading and the one before is coming back, and the transfers overlap the work instead of waiting for it. The upload itself gets faster too. Today the 5060 Ti moves a 3.3 MB batch in 2.7 ms, about 1.2 GB/s, far below what its PCIe link can carry, with the host converting every number from 64-bit to 32-bit floats along the way. Pinned 32-bit buffers and transfers that do not block are meant to take that conversion off the critical path.
explainwill show the stages, and the measurements will report sustained items per second, first for the world model against OpenBLAS and Accelerate, then for retrieval.The ML models give pipelining two kinds of work. The world model is a stream of independent batches of any size, the plain case for chunking. The denoiser has ten dependent steps per batch, so a stream of batches pipelines step by step: one batch at step t while the next is at step t minus 1. Neither needs anything new from the ML side, since how a batch is cut is the schedule’s choice, and both give the same answers however it is cut.
The road from here
First the direction, then the examples built to beat the CPU:
- The lowering, done. X_eTaL source and the shapes of its inputs in, a program in the GPU’s form out, through X_eTaL’s own crates, with a reason given for anything outside the subset. Every example now runs this way.
- Running from source, done.
xetal-gpu run program.xtl --device opencl:0runs a program straight from its source. A statement the GPU cannot take, a sort or awhere, no longer stops the program: the evaluator computes it and hands the result to the GPU as an input, and everything after it runs on the device.explainshows the X_eTaL line each kernel came from. Thirteen examples now agree with the evaluator this way on the M1 Max, and on the RTX 5060 Ti under Linux, each lowered from its own source with no changes. - The macro, done.
gp:a_ccel<, as above: a function written in X_eTaL, marked for the GPU, lowered and run there, its compiled program reused across calls with the same shapes. - The models from their own source, under way now. The world model and the benchmarks run from X_eTaL-ML’s own programs through the macro, and the results tables say they were run from source.
- Pipelining. Chunks of a batch overlapping their upload, compute and download, as above, measured as sustained items per second.
- Retrieval against a resident index. The first example built to beat the CPU’s library, written in X_eTaL and run through the macro: an index of hundreds of thousands of documents, each embedded as 256 numbers, kept on the GPU through a session. A batch of queries is scored against all of it with one product, and the best few for each query are kept by a top-k, measured against NumPy’s library with fresh queries on every call. Each number uploaded buys a great many comparisons, the shape the rule asks for. Its two operations are done: lookup, the gather every transformer’s embedding uses, and top-k. On 256 queries against 100,000 documents on the M1 Max, the top-k kernel takes 122 ms, against 92 ms for the scoring product.
- A GPT, swept by width. X_eTaL-ML’s MicroGPT is the trained anchor, but at 4,192 weights it is below every card’s crossover. So the same program runs at widths from 16 to 1,024 and from one layer to four, on a batch of prompts with only token ids uploaded and the weights resident, measured in tokens per second against NumPy’s library. Where each card overtakes the CPU is then measured, not claimed. The typed-decision classifier is the same block with a classification head.
- Training. A training step, forward, backward and Adam, as one program per step with the weights resident. Training is where products dominate most, and the weights and their gradients stay on the device between steps, so only each batch moves. Each line of a backward pass is a product with a transpose, which is why transpose came first. The tiny GPT trained from scratch, then GPT-2 small fine-tuned on a small corpus, with the memory each card needs.
- The CNNs. The convolution’s windows are now in the GPU’s form, so the Tiny CNN and CNN training can follow.
- A conditional memory after DeepSeek’s Engram, hashed n-grams looked up in a table. On a GPU that is a gather, so the point there is X_eTaL’s concision and the table’s size, not speed.
- A mixture of experts, first the array way, every expert computing and the router’s mask keeping what was chosen, and a sparse version only if that measures too slow.
Each of these will be measured against both baselines, the evaluator and tuned CPU code.
On Apple silicon there is one more question. Apple deprecated OpenCL years ago in favor of Metal, and the M1 Max pays about 1.3 ms a call through it. A planned post explores using Modular’s MAX and Mojo in place of OpenCL, running on Metal on the Macs, for another round of performance measurements on the same chips. In the end the language itself takes over the IR and the lowering, and the whole thing becomes one command: xetal run --device opencl:0 program.xtl.
The cards
OpenCL is the one runtime that reaches all of them, old and new. Testing every card takes a long time: most need to be fitted into a machine, and some of those machines are themselves being repaired. So the cards come in three groups.
First: the cards being measured now. The M1 Max and the RTX 5060 Ti have run; the 3090 and 3060 follow.
| Card | Architecture | Memory | Its role |
|---|---|---|---|
| Apple M1 Max | Apple GPU | 64 GB unified | development; measured; the higher memory bandwidth |
| RTX 5060 Ti | Blackwell | 16 GB | the newest generation of these cards; measured, the first NVIDIA card |
| RTX 3090 | Ampere | 24 GB | the most memory of the NVIDIA cards I’m working with |
| RTX 3060 | Ampere | 12 GB | a mid-range current card; several of them |
Follow-on: once the use-cases and measurements are settled on those, a second Apple GPU, and one or two of these older or smaller data-center cards:
| Card | Architecture | Memory | Its role |
|---|---|---|---|
| Apple M3 Pro | Apple GPU | 18 GB unified | a newer Apple generation, with less memory and less bandwidth |
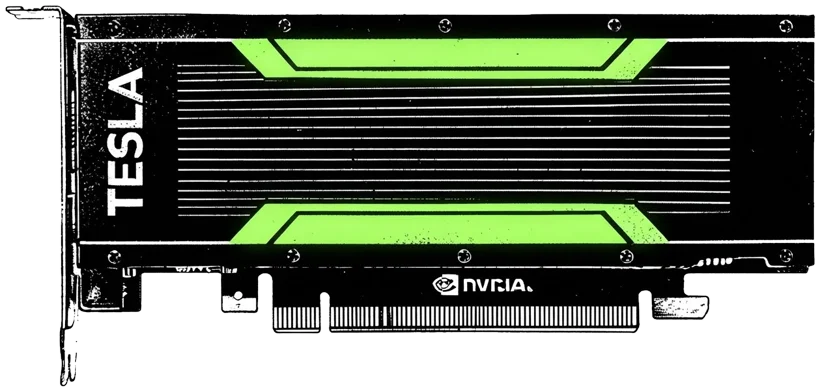
| Tesla P4 | Pascal | 8 GB | an old, low-power card the newest CUDA toolkits retire |
| A2 | Ampere | 16 GB | a small, low-power data-center card |
| Tesla P100 | Pascal | 12 GB and 16 GB, one of each | an old data-center card the newest CUDA toolkits retire |
| Tesla M40 | Maxwell | 12 GB and 24 GB, one of each | an old data-center card the newest CUDA toolkits retire |
Future, maybe: cards that may be tested later, the K4200 and the 1660 Super the most likely:
| Card | Architecture | Memory | Its role |
|---|---|---|---|
| Quadro K4200 | Kepler | 4 GB | the oldest and smallest of these cards: the case where weights stay on the host |
| GTX 1660 Super | Turing | 6 GB | a small current card |
| Tesla M10 | Maxwell | four GPUs of 8 GB | built to stream many remote desktops, not to run LLMs; each GPU its own device |
| RTX 3060 Laptop GPU | Ampere | 6 GB | in a System76 laptop |
| RTX 4070 Laptop GPU | Ada Lovelace | 8 GB | in an Asus ROG laptop |
Each card runs a program by a schedule file. The 5060 Ti has its own two, in 32-bit and 64-bit floats, with work-groups of 256: the card allows 1,024, but its compiled reduction kernel allows only 256, and the runtime reported that limit rather than failing. The other NVIDIA cards share templates, untested until a card runs them. Nothing in the code changed for the move to Linux. After each group comes a table of what ran where and how fast, and then smaller numbers: 16-bit floats, 8-bit integers and ternary weights.
What the work asks for
The asks between the repositories show where each layer of the stack still falls short:
- Of X_eTaL-gpu, from X_eTaL-ML: run its models from a pinned commit, now done for the world model and the benchmarks; transpose and the convolution’s windows, both now done.
- Of X_eTaL-extensions: a newer X_eTaL inside the bridge, since the ML libraries use private helpers and tuples its version lacks; and arrays across the bridge in binary, now half done for inputs.
- Of the language: the accelerator IR, the lowering to it, and array shapes known when a program is compiled. Rather than wait, the GPU repo has built the lowering itself, through X_eTaL’s own crates, and it moves into the language when the language takes it on.
This post will be updated as the models land on the cards.
Part 7 of the Array Languages series. View all parts | Next: Part 8 →
Comments or questions? SW Lab Discord or YouTube @SoftwareWrighter.